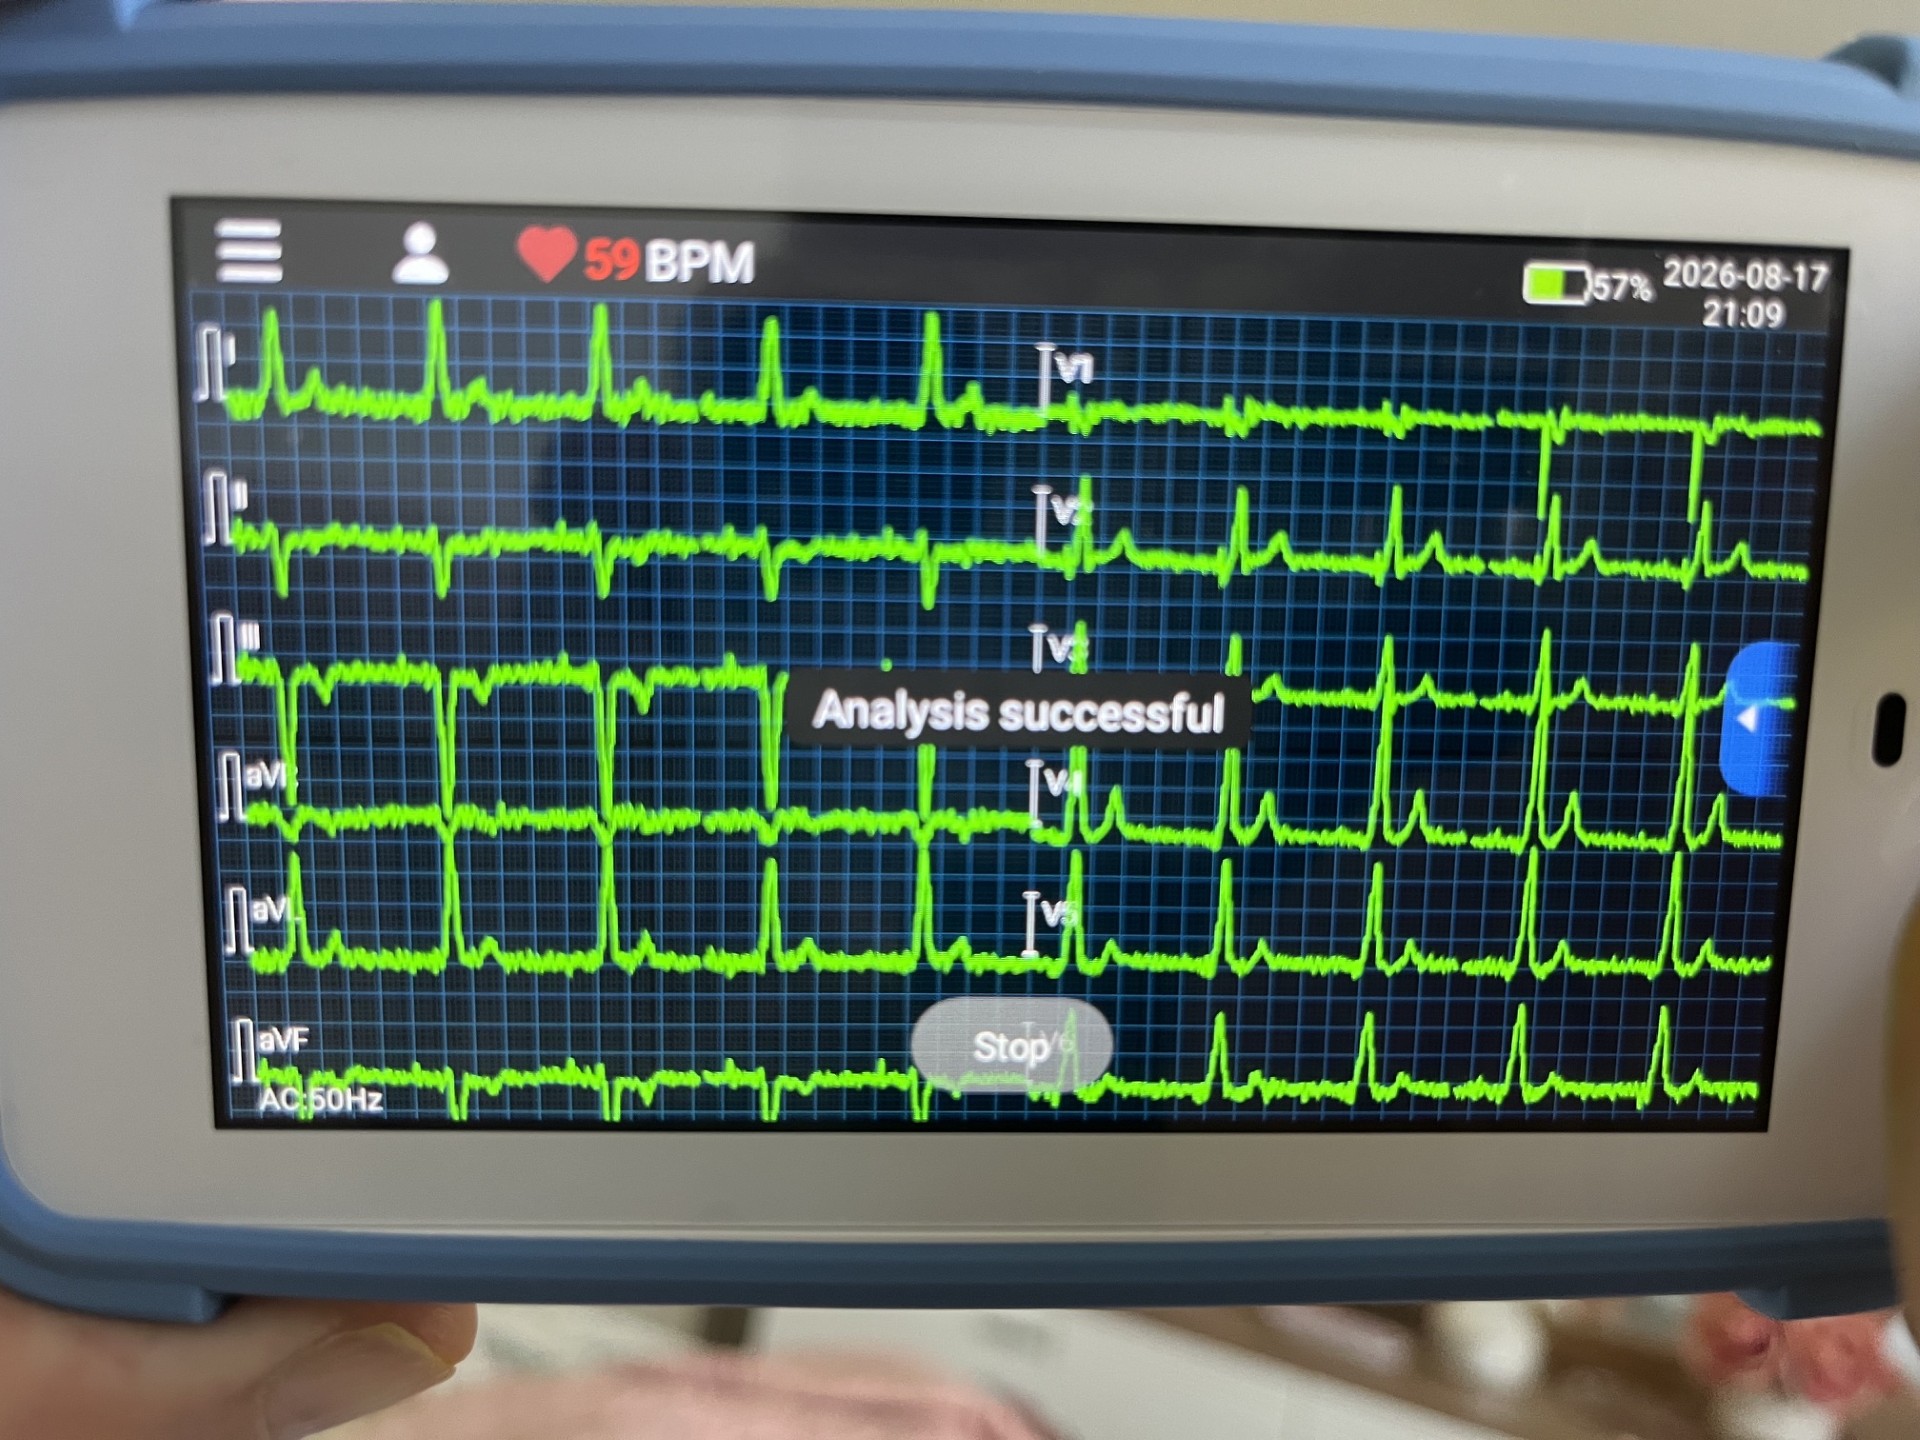
This page is a plain description of what appears on the screen, separated from the question of what it means. The interpretation lives on the companion pages; here the aim is simply to name every element, so that anyone looking at a similar display knows what they are looking at.
The status bar
Heart rate
59 BPM, with a heart icon. This is the device's own averaged rate over the acquisition window, not a beat-to-beat instantaneous value.
Battery
57 %. Worth noting only because low battery states on some units silently reduce sampling or display quality.
Timestamp
2026-08-17, 21:09. The hour matters in a paced patient: evening recordings can fall inside a programmed rest-rate or hysteresis window.
Menu and patient icons
Standard controls for settings and for the patient record the trace will be filed under. No patient identifiers are shown on this screen.
The lead layout
Handheld twelve-lead units almost universally use a two-column, six-row grid, because it fits the conventional ordering onto a small landscape screen without compressing the amplitude scale. Each channel begins with a small rectangular step at its left edge: that is the one millivolt calibration pulse, which establishes the vertical scale for that trace.
The consequence of this layout is worth stating explicitly, because it is what makes artefact readable. A fault at one physical electrode expresses itself down one column or in a predictable subset of derived leads — not randomly across the screen. So the distribution of an artefact is itself evidence about its cause.
The filter label
The bottom left corner reads AC:50Hz. This reports the centre frequency of the mains notch filter — a narrow band-stop filter that removes the interference radiated by building wiring and nearby equipment. Because that interference sits at the local supply frequency, the filter must be matched to it: 50 Hz across Europe, Africa and most of Asia; 60 Hz across North America and parts of South America. The setting is user-selectable, and it is one of the most common sources of avoidable artefact when a device is used in a region other than the one it was configured for.
Where each artefact sits
- Continuous fine oscillation — present on all twelve channels, densest in the limb leads. Combined electromyographic and, if the filter is mismatched, powerline interference.
- Rectangular flat-topped excursions — lead III and the aVR/aVL rows carry the clearest examples, with one intruding into the V1 row. Front-end amplifier saturation and recovery from an abrupt impedance change at one electrode.
- Cleanest signal — V2 through V6. These carry the most recognisable complexes on the screen and are the only channels from which morphology could even be discussed.
- Interface occlusion — the Analysis successful toast over V3; the Stop button over the V6 label.
That the algorithm ran to completion without an internal error. It is a statement about the software, not a certification of signal quality or of clinical validity. Automated interpretation has two well-known weak areas that both apply here: paced rhythms, where stimuli may be missed or misclassified, and contaminated baselines, where muscle or mains artefact can be reported as atrial fibrillation. On a visibly noisy trace, this message should prompt scrutiny rather than reassurance.
Why the photograph is not the recording
Every observation above comes from a photograph of a live screen, and that method destroys the properties that make an electrocardiogram measurable. The display is curved and glossy and was photographed at an angle, so the grid behind the traces is distorted by perspective and cannot serve as a ruler for amplitude or duration. Screen refresh and camera exposure interact to produce banding that can add or erase fine detail. The captured resolution is far below the device's own sampling resolution, so short, low-amplitude features — including pacing stimuli and the terminal deflections that matter most in conduction system pacing — may simply not survive the transfer. And interface elements sit on top of the waveform in a way they never do in an exported file.
For anything beyond an informal look, the recording should be exported or printed from the device itself. Then the calibration, the paper speed, the gain and the full sampled waveform arrive intact, and a clinician is reading the signal rather than a picture of it.
¿Qué muestra exactamente esta pantalla de ECG de 12 derivaciones?
Esta sección describe llanamente lo que aparece en la pantalla, separando esa descripción de la cuestión de qué significa. La interpretación está en las páginas complementarias; aquí el objetivo es simplemente nombrar cada elemento, para que quien mire una pantalla parecida sepa qué está mirando.
La barra de estado
Frecuencia cardíaca
59 lpm, con icono de corazón. Es la frecuencia promediada por el propio equipo durante la ventana de adquisición, no un valor instantáneo latido a latido.
Batería
57 %. Solo merece mención porque en algunos equipos los estados de batería baja reducen de forma silenciosa el muestreo o la calidad de la representación.
Fecha y hora
17-08-2026, 21:09. La hora importa en un paciente portador de marcapasos: los registros vespertinos pueden caer dentro de una ventana de frecuencia de reposo o de histéresis.
Iconos de menú y paciente
Controles habituales de ajustes y del registro de paciente bajo el que se archivará el trazado. En esta pantalla no se muestra ningún identificador personal.
La disposición de las derivaciones
Los equipos portátiles de doce derivaciones utilizan casi siempre una retícula de dos columnas y seis filas, porque encaja el orden convencional en una pantalla apaisada pequeña sin comprimir la escala de amplitud. Cada canal comienza con un pequeño escalón rectangular en su borde izquierdo: es el pulso de calibración de un milivoltio, que fija la escala vertical de ese trazado.
Conviene enunciar de forma explícita la consecuencia de esta disposición, porque es lo que hace legible el artefacto. Un fallo en un electrodo físico se manifiesta a lo largo de una columna o en un subconjunto predecible de derivaciones derivadas, no de forma aleatoria por toda la pantalla. Así, la distribución de un artefacto es en sí misma una prueba sobre su causa.
La etiqueta del filtro
La esquina inferior izquierda muestra AC:50Hz. Informa de la frecuencia central del filtro de muesca de red: un filtro de banda eliminada estrecho que suprime la interferencia irradiada por el cableado del edificio y los equipos próximos. Como esa interferencia se sitúa en la frecuencia del suministro local, el filtro debe coincidir con ella: 50 Hz en Europa, África y la mayor parte de Asia; 60 Hz en Norteamérica y parte de Sudamérica. El ajuste lo elige el usuario y es una de las fuentes más frecuentes de artefacto evitable cuando un equipo se emplea en una región distinta de aquella para la que se configuró.
Dónde se sitúa cada artefacto
- Oscilación fina continua — presente en las doce derivaciones, más densa en las de miembros. Interferencia electromiográfica y, si el filtro no coincide, también de red eléctrica.
- Excursiones rectangulares de techo plano — la derivación III y las filas de aVR y aVL contienen los ejemplos más claros, con una que invade la fila de V1. Saturación y recuperación del amplificador de entrada ante un cambio brusco de impedancia en un electrodo.
- Señal más limpia — de V2 a V6. Son los canales con los complejos más reconocibles de la pantalla y los únicos sobre los que cabría siquiera discutir morfología.
- Oclusión por la interfaz — el aviso Analysis successful sobre V3; el botón Stop sobre la etiqueta de V6.
Que el algoritmo terminó sin error interno. Es una afirmación sobre el programa, no una certificación de la calidad de la señal ni de la validez clínica. La interpretación automática tiene dos puntos débiles bien conocidos que aquí se dan a la vez: los ritmos estimulados, en los que las espigas pueden pasar desapercibidas o clasificarse mal, y las líneas de base contaminadas, en las que el artefacto muscular o de red puede informarse como fibrilación auricular. Sobre un trazado visiblemente ruidoso, este mensaje debe invitar al escrutinio y no a la tranquilidad.
Por qué la fotografía no es el registro
Todas las observaciones anteriores proceden de la fotografía de una pantalla en vivo, y ese método destruye justamente las propiedades que hacen medible un electrocardiograma. La pantalla es curva y brillante y se fotografió en ángulo, de modo que la retícula que hay tras los trazados queda deformada por la perspectiva y no sirve como regla ni para la amplitud ni para la duración. El refresco de pantalla y la exposición de la cámara interactúan y producen bandeados que pueden añadir o borrar detalle fino. La resolución capturada es muy inferior a la resolución de muestreo del propio equipo, así que los elementos breves y de baja amplitud —incluidas las espigas de estimulación y las deflexiones terminales que más importan en la estimulación del sistema de conducción— pueden sencillamente no sobrevivir a la transferencia. Y los elementos de la interfaz se superponen a la onda de un modo que nunca ocurre en un archivo exportado.
Para cualquier finalidad que vaya más allá de una mirada informal, el registro debe exportarse o imprimirse desde el propio equipo. Así llegan intactos la calibración, la velocidad de papel, la ganancia y la onda muestreada completa, y el profesional lee la señal en lugar de una fotografía de la señal.
Frequently asked questions · Preguntas frecuentes
What exactly is shown on this handheld 12-lead ECG screen?
A complete twelve-lead electrocardiogram in the conventional two-column layout: limb leads I, II, III, aVR, aVL and aVF on the left; precordial leads V1 to V6 on the right; each channel preceded by a calibration step. The status bar shows 59 beats per minute, a battery at 57 per cent and a timestamp of 17 August 2026 at 21:09. The bottom left reads AC:50Hz, reporting the mains notch filter setting. An Analysis successful message overlies V3 and a Stop button covers the V6 label. Within the waveform: continuous fine oscillation on all twelve channels, several large flat-topped rectangular deflections in the limb lead channels, and comparatively clean signal in V2 through V6.
How are the twelve leads arranged on a display like this?
Two columns of six rows. The left column runs I, II, III, aVR, aVL, aVF from top to bottom; the right column runs V1 to V6. Each row opens with a one millivolt calibration step that sets the vertical scale. The layout matters diagnostically: a fault at one physical electrode expresses itself down one column or in a predictable subset of derived leads, so where an artefact appears is evidence about what caused it.
What does the AC:50Hz label mean?
It reports the centre frequency of the mains notch filter, which removes powerline interference radiated by building wiring and nearby equipment. The filter must match the local supply: 50 Hz in Europe, Africa and most of Asia; 60 Hz in North America and parts of South America. Set to 50 Hz on a 60 Hz supply, it leaves the interference almost entirely unattenuated while discarding a slice of genuine signal — producing a persistent fine oscillation easily mistaken for tremor.
Does "Analysis successful" mean the recording is good?
No. It reports that the interpretation algorithm ran without an internal error — a statement about the software, not about signal quality or clinical validity. Algorithms are validated on recordings that meet quality assumptions, and when those are violated they do not necessarily fail loudly; they can return a confident and incorrect result. Paced rhythms and contaminated baselines are both known weak areas.
Why is a photograph of the screen not equivalent to the recording?
Because it loses the properties that make an ECG measurable. A curved glossy screen photographed at an angle distorts the grid by perspective, so it cannot be used as a ruler. Refresh and exposure produce banding that adds or erases fine detail. Captured resolution falls far below the device's sampling resolution, so short low-amplitude features — pacing stimuli among them — may not survive. Interface elements sit on the waveform. Export or print from the device instead.